

Hardware was the heavy line
In its first year in Wellfish, 2022, Cubist's approved transactions added up to 32.5 tonnes CO₂e. The list of the largest lines was short and clear: computer screens 10.0 tonnes, other electronics 5.7 tonnes, air travel 5.5 tonnes and computers 3.2 tonnes. A consultancy buys screens and computers, and that is where the weight was.
That is a different picture from the one a rule of thumb gives. Headcount times an industry figure says nothing about which purchases weigh. Here it was immediately visible which line could be acted on.
“At Cubist we work as consultants developing IT solutions for the healthcare of tomorrow. Working with care and health is an ethical stance, and on the same ethical basis we want to reduce the negative impact of our operations. With Wellfish we have gained a framework that has helped us find our impact points and improve where it has the greatest effect. We have introduced automated calculations of our GHG emissions, and with that information we have made targeted changes that have halved our emissions in just a few years. The system is easy to work with and the people at Wellfish contribute their experience and expertise.”
Four years in one system
Since then, Cubist has calculated every year the same way. The total went from 32.5 tonnes in 2022 to 29.4 tonnes in 2023, 18.2 tonnes in 2024 and 17.5 tonnes in 2025. That is 46 percent lower in four years.
Total per year, tonnes CO₂e
- 202232.5
- 202329.4
- 202418.2
- 202517.5
The point is that the method stays the same all the way. The GHG Protocol, scope 1 to 3, no changes mid-series. That is why the years can be compared, and why every tonne can be traced back to a line in the accounts.
The company grew. So Cubist counts per employee.
A total can move the wrong way for the wrong reason. A company that hires more people gets more computers, more trips and more lunches. Per employee is the fair comparison.
In 2022, Cubist was at 1.0 tonne CO₂e per person per year. In 2025 the figure is 0.6 tonnes. That is 41 percent lower, or 0.4 tonnes less per person per year. About 2,000 km in a petrol car.
Per employee per year
2022
1.0
tonnes CO₂e per person
2025
0.6
tonnes CO₂e per person
No heavy lines. Just many small ones.
In 2025 the list looks different. The largest line is software and IT at 2.6 tonnes, followed by other electronics 2.6, meals 2.4, computers 2.0 and district heating 1.9. In 2022 the largest line was 10.0 tonnes. Now there is no line left to point at, just several small ones.
Largest lines · tonnes CO₂e
2022
- Computer screens10.0
- Other electronics5.7
- Air travel5.5
- Computers3.2
2025
- Software & IT2.6
- Other electronics2.6
- Meals2.4
- Computers2.0
- District heating1.9
Almost everything sits in scope 3: 15.5 of 17.5 tonnes. Scope 2, electricity and district heating, is 2.0 tonnes. Scope 1 is zero, because the company has no vehicles or boilers of its own.
Quarter by quarter
The calculation updates when the accounts do. Cubist sees its emissions quarter by quarter, instead of once a year in hindsight. The effect of a decision shows within the same year.
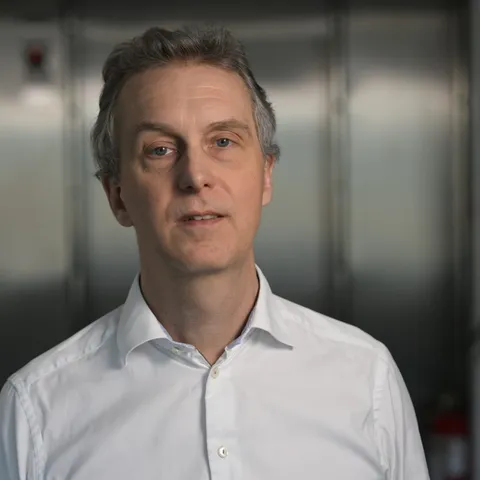
“At Cubist we are driven by our core values, “healthier and happier”. We work with technology that should do good for people, and we have our roots in medical technology. Sustainability matters to us, because it goes hand in hand with our values. To make a difference on sustainability we need to know where our big impact points are. Wellfish has helped us automate how we get our emissions data. We can now see, quarter by quarter, what our emissions look like and where we can improve. For us, that has meant we can improve by focusing on what really makes a difference.”
How does Cubist compare with other service companies?
The median for Swedish IT consultancies and SaaS companies in Wellfish is 2.5 tonnes CO₂e per employee per year, with a typical range of 0.8 to 5 tonnes. Cubist's 0.6 tonnes for 2025 is below the lower end of that range. The comparison is indicative: companies differ in size, travel patterns and premises.
Compared with other service companies · tonnes CO₂e per employee per year
- Cubist 2025
- 0.6
- Median, Swedish service companies
- 2.5
- Typical range
- 0.8–5
The figure comes from the accounts
No survey. No guessing. The transactions are fetched automatically, every purchase is matched to the right emission factor, and the method is the same every year. Every tonne can be traced down to the line in the accounts. It holds up to audit, and it holds up when a customer asks how you calculated it.